
File:Spectral effects of decimation compared on 3 popular frequency scale conventions.pdf

此 PDF 檔案的 JPG 預覽的大小:720 × 600 像素。 其他解析度:288 × 240 像素 | 576 × 480 像素 | 922 × 768 像素 | 1,229 × 1,024 像素 | 1,800 × 1,500 像素。
原始檔案 (1,800 × 1,500 像素,檔案大小:26 KB,MIME 類型:application/pdf)
摘要
| 描述 |
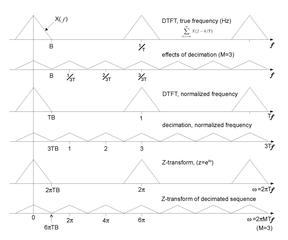
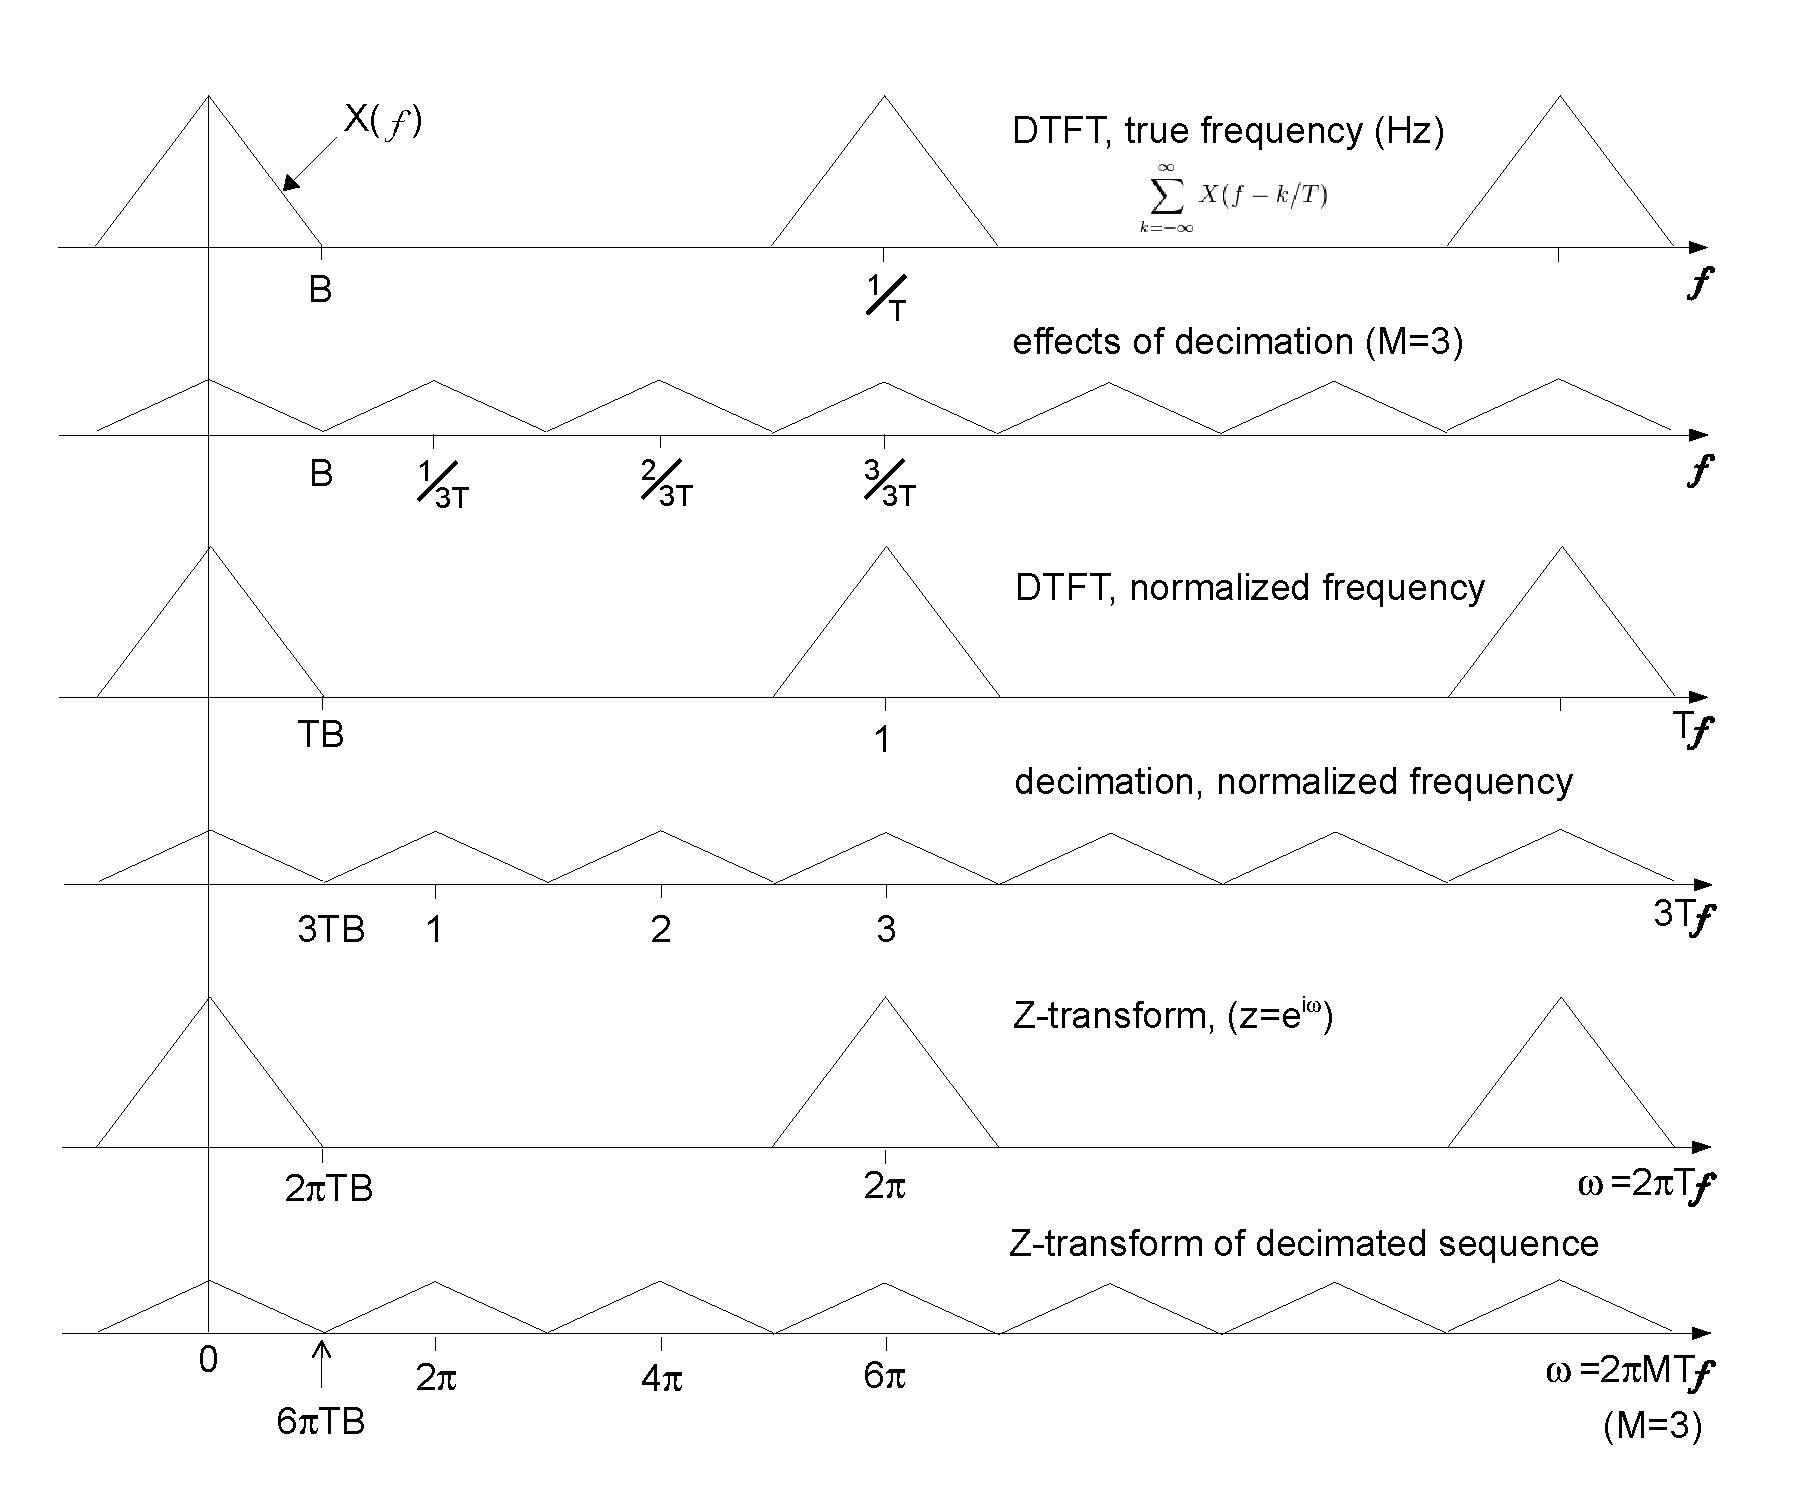
English: Each of 3 pairs of graphs depicts the spectral distributions of an oversampled function and the same function sampled at 1/3 the original rate. The bandwidth, B, in this example is just small enough that the slower sampling does not cause overlap (aliasing). The top pair of graphs represent the discrete-time Fourier transform (DTFT) representation. The middle pair, depict a normalized frequency scale, preferred by many filter design programs. The frequency, f, in Hz is divided by the sample-rate. The periodicity and Nyquist frequency are then represented by constants, 1 and 1/2 respectively. The bottom pair depict a different normalized frequency scale, used by the Z-transform... the periodicity and Nyquist frequency are respectively represented by 2π and π. |
|||
| 日期 | ||||
| 來源 | 自己的作品. The first two graphs correspond to the top and bottom graphs of Harris[1], Figure 2.10 | |||
| 作者 | Bob K | |||
| 授權許可 (重用此檔案) |
我,本作品的著作權持有者,決定用以下授權條款發佈本作品:
|
|||
| 其他版本 | Derivative works of this file: Spectral effects of decimation.pdf | |||
| References |
|
檔案歷史
點選日期/時間以檢視該時間的檔案版本。
| 日期/時間 | 縮圖 | 尺寸 | 使用者 | 備註 | |
|---|---|---|---|---|---|
| 目前 | 2014年1月19日 (日) 16:34 |  | 1,800 × 1,500(26 KB) | Bob K | rescale 4th graph |
| 2014年1月19日 (日) 15:52 | 沒有縮圖 | 0 × 0(26 KB) | Bob K | User created page with UploadWizard |
檔案用途
下列頁面有用到此檔案:
全域檔案使用狀況
以下其他 wiki 使用了這個檔案:
- sr.wikipedia.org 的使用狀況