
File:World oil consumption 1980 to 2007 by region.svg

此 SVG 檔案的 PNG 預覽的大小:600 × 450 像素。 其他解析度:320 × 240 像素 | 640 × 480 像素 | 1,024 × 768 像素 | 1,280 × 960 像素 | 2,560 × 1,920 像素。
原始檔案 (SVG 檔案,表面大小:600 × 450 像素,檔案大小:101 KB)
摘要
| 描述 |
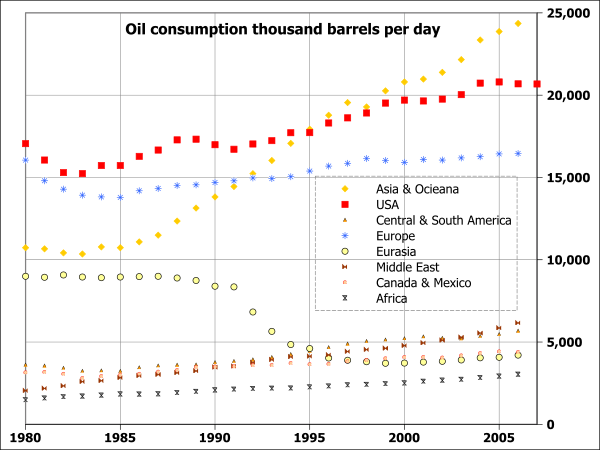
English: Daily oil consumption by region from 1980 to 2006; vertical scale shows thousands of barrels per day, and the horizontal scale shows years from 1980 to 2007. |
| 日期 | |
| 來源 | I, 84user, created this work using the excel file RecentPetroleumConsumptionBarrelsperDay.xls from the U.S. Energy Information Administration's web page http://tonto.eia.doe.gov/dnav/pet/pet_pri_wco_k_w.htm (direct link: http://www.eia.doe.gov/emeu/international/RecentPetroleumConsumptionBarrelsperDay.xls) and using Open Source Gnumeric 1.9.1 to produce the chart |
| 作者 | 84user (talk) |
授權條款
| 此作品已由其作者,英文維基百科的84user,釋出至公有領域。此授權條款在全世界均適用。 這可能在某些國家不合法,如果是的話: 84user授予任何人有權利使用此作品於任何用途,除受法律約束外,不受任何限制。 |
原始上傳日誌
Transferred from en.wikipedia to Commons by Skiff using CommonsHelper.
The original description page was here. All following user names refer to en.wikipedia.
- 2008-10-24 20:32 84user 600×450× (103638 bytes) {{Information |Description=Daily oil consumption by region from 1980 to 2006; vertical scale shows thousands of barrels per day, and the horizontal scale shows years from 1980 to 2007. Related charts: [[Image:World oil price in dollars from 1978 to 2008-1
檔案歷史
點選日期/時間以檢視該時間的檔案版本。
| 日期/時間 | 縮圖 | 尺寸 | 使用者 | 備註 | |
|---|---|---|---|---|---|
| 目前 | 2011年3月12日 (六) 18:54 | | 600 × 450(101 KB) | File Upload Bot (Magnus Manske) | {{BotMoveToCommons|en.wikipedia|year={{subst:CURRENTYEAR}}|month={{subst:CURRENTMONTHNAME}}|day={{subst:CURRENTDAY}}}} {{Information |Description={{en|Daily oil consumption by region from 1980 to 2006; vertical scale shows thousands of barrels per day, a |
檔案用途
下列頁面有用到此檔案:
全域檔案使用狀況
以下其他 wiki 使用了這個檔案:
- ar.wikipedia.org 的使用狀況
- en.wikipedia.org 的使用狀況
- fr.wikipedia.org 的使用狀況
- ro.wikipedia.org 的使用狀況
- simple.wikipedia.org 的使用狀況
- ta.wikipedia.org 的使用狀況
- th.wikipedia.org 的使用狀況
- uk.wikipedia.org 的使用狀況
- ur.wikipedia.org 的使用狀況