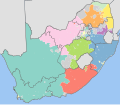
File:South Africa 2001 dominant language map.svg
外觀

此 SVG 檔案的 PNG 預覽的大小:689 × 600 像素。 其他解析度:276 × 240 像素 | 552 × 480 像素 | 882 × 768 像素 | 1,177 × 1,024 像素 | 2,353 × 2,048 像素 | 1,072 × 933 像素。
原始檔案 (SVG 檔案,表面大小:1,072 × 933 像素,檔案大小:1,024 KB)
檔案歷史
點選日期/時間以檢視該時間的檔案版本。
| 日期/時間 | 縮圖 | 尺寸 | 使用者 | 備註 | |
|---|---|---|---|---|---|
| 目前 | 2010年11月29日 (一) 11:42 |  | 1,072 × 933(1,024 KB) | Htonl | tweak |
| 2010年10月2日 (六) 14:18 |  | 1,072 × 933(1.02 MB) | Htonl | new approach, smaller filesize | |
| 2010年10月1日 (五) 21:51 |  | 1,072 × 933(2.92 MB) | Htonl | Reverted to version as of 17:41, 1 October 2010 | |
| 2010年10月1日 (五) 21:33 |  | 1,072 × 933(2.79 MB) | Htonl | tweak | |
| 2010年10月1日 (五) 17:41 |  | 1,072 × 933(2.92 MB) | Htonl | use equal-area projection | |
| 2010年2月16日 (二) 18:50 |  | 1,000 × 786(2.81 MB) | Htonl | tweak | |
| 2010年2月7日 (日) 19:49 |  | 1,000 × 786(3.04 MB) | Htonl | and again | |
| 2010年2月7日 (日) 19:43 |  | 1,000 × 786(3.04 MB) | Htonl | change "none" colour | |
| 2010年2月7日 (日) 00:50 |  | 1,000 × 786(3.04 MB) | Htonl | =={{int:filedesc}}== {{Information |Description={{en|1=Map showing the dominant homelanguages in South Africa, according to Census 2001 at the "Main Place" level. In this context, a language is dominant if it more than 50% of the population in an area spe |
檔案用途
下列頁面有用到此檔案:


