
File:Mpl screenshot figures and code.png

預覽大小:752 × 599 像素。 其他解析度:301 × 240 像素 | 602 × 480 像素 | 964 × 768 像素 | 1,227 × 978 像素。
原始檔案 (1,227 × 978 像素,檔案大小:350 KB,MIME 類型:image/png)
摘要
| 描述 |
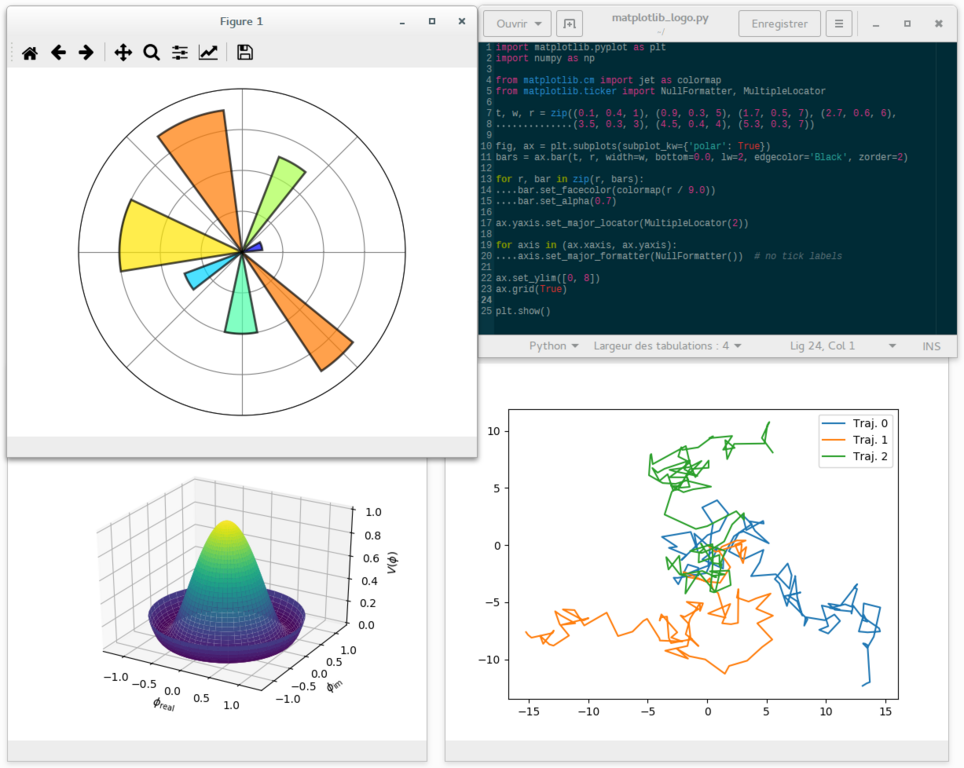
English: A screenshot showing matplotlib plots of a polar bar graph resembling the matplotlib logo (upper left), a 3D surface graph with the new default 'viridis' colormap (lower left), a graph of 2D random walk trajectories (lower right), and the python source code (of the logo part) opened in a text editor (upper right). |
| 日期 | |
| 來源 | 自己的作品 |
| 作者 | Adrien F. Vincent |
Rationale: this work aims at providing an up-to-date version of the previous work https://en.wikipedia.org/wiki/File:Matplotlib_screenshot.png , done by Geek3.
The matplotlib (mpl) version is the development branch 2.x, with Python 2.7.11 and numpy 1.11.1
##########
## Code for the mpl logo figure
##########
import matplotlib.pyplot as plt
import numpy as np

from matplotlib.cm import jet as colormap
from matplotlib.ticker import NullFormatter, MultipleLocator

t, w, r = zip((0.1, 0.4, 1), (0.9, 0.3, 5), (1.7, 0.5, 7), (2.7, 0.6, 6),
              (3.5, 0.3, 3), (4.5, 0.4, 4), (5.3, 0.3, 7))

fig, ax = plt.subplots(subplot_kw={'polar': True})
bars = ax.bar(t, r, width=w, bottom=0.0, lw=2, edgecolor='Black', zorder=2)

for r, bar in zip(r, bars):
    bar.set_facecolor(colormap(r / 9.0))
    bar.set_alpha(0.7)

ax.yaxis.set_major_locator(MultipleLocator(2))

for axis in (ax.xaxis, ax.yaxis):
    axis.set_major_formatter(NullFormatter())  # no tick labels

ax.set_ylim([0, 8])
ax.grid(True)

plt.show()
####################
##########
## Code for the 3D surface plot and the 2D random walk tajectories
##########
import matplotlib.pyplot as plt
import numpy as np

from mpl_toolkits.mplot3d import Axes3D
from matplotlib.cm import viridis as colormap

"""
Figure 1: a 3D surface plot (from matplotlib gallery)
"""
step = 0.04
maxval = 1.0
fig1 = plt.figure("Figure_1")
ax1 = fig1.add_subplot(111, projection='3d')

# Create supporting points in polar coordinates
r = np.linspace(0, 1.2, 50)
p = np.linspace(0, 2*np.pi, 50)
R, P = np.meshgrid(r, p)
# Transform them to cartesian system
X, Y = R*np.cos(P), R*np.sin(P)

Z = ((R**2 - 1)**2)
ax1.plot_surface(X, Y, Z, rstride=1, cstride=1, cmap=colormap)
ax1.set_zlim3d(0, 1)
ax1.set_xlabel(r'$\phi_\mathrm{real}$')
ax1.set_ylabel(r'$\phi_\mathrm{im}$')
ax1.set_zlabel(r'$V(\phi)$')

"""
Figure 2: a few examples of 2D random walk
"""
fig2, ax2 = plt.subplots(num="Figure_2")

prng = np.random.RandomState(123)

x = np.linspace(0, 10, 101)

def random_walk(xy0=(0.0, 0.0), nsteps=100, std=1.0):
    xy = np.zeros((nsteps + 1, 2))
    xy[0,:] = xy0
    deltas = prng.normal(loc=0.0, scale=std, size=(nsteps, 2))
    xy[1:, :] = xy[0, :] + np.cumsum(deltas, axis=0)
    return xy

for cnt in range(3):
    traj = random_walk()
    ax2.plot(traj[:, 0], traj[:, 1], label="Traj. {c}".format(c=cnt))

ax2.legend(loc='best')

plt.show()
####################
授權條款
我,本作品的著作權持有者,決定用以下授權條款發佈本作品:
此檔案採用創用CC 姓名標示-相同方式分享 4.0 國際授權條款。
- 您可以自由:
- 分享 – 複製、發佈和傳播本作品
- 重新修改 – 創作演繹作品
- 惟需遵照下列條件:
- 姓名標示 – 您必須指名出正確的製作者,和提供授權條款的連結,以及表示是否有對內容上做出變更。您可以用任何合理的方式來行動,但不得以任何方式表明授權條款是對您許可或是由您所使用。
- 相同方式分享 – 若要根據本素材進行再混合、轉換或創作,則必須以與原作相同或相容的授權來發布您的作品。
檔案歷史
點選日期/時間以檢視該時間的檔案版本。
| 日期/時間 | 縮圖 | 尺寸 | 使用者 | 備註 | |
|---|---|---|---|---|---|
| 目前 | 2016年9月27日 (二) 09:52 | | 1,227 × 978(350 KB) | Adrien F. Vincent | User created page with UploadWizard |
檔案用途
下列頁面有用到此檔案:
全域檔案使用狀況
以下其他 wiki 使用了這個檔案:
- bn.wikipedia.org 的使用狀況
- en.wikipedia.org 的使用狀況
- fr.wikipedia.org 的使用狀況
- hu.wikipedia.org 的使用狀況
- ja.wikipedia.org 的使用狀況
- ko.wikipedia.org 的使用狀況
- pl.wikipedia.org 的使用狀況
- pt.wikipedia.org 的使用狀況
- sr.wikipedia.org 的使用狀況
- tr.wikipedia.org 的使用狀況