
File:2012 Poverty distribution map in India by its states and union territories.svg

此 SVG 檔案的 PNG 預覽的大小:544 × 599 像素。 其他解析度:218 × 240 像素 | 436 × 480 像素 | 697 × 768 像素 | 930 × 1,024 像素 | 1,859 × 2,048 像素 | 1,578 × 1,738 像素。
原始檔案 (SVG 檔案,表面大小:1,578 × 1,738 像素,檔案大小:823 KB)
摘要
| 描述 |
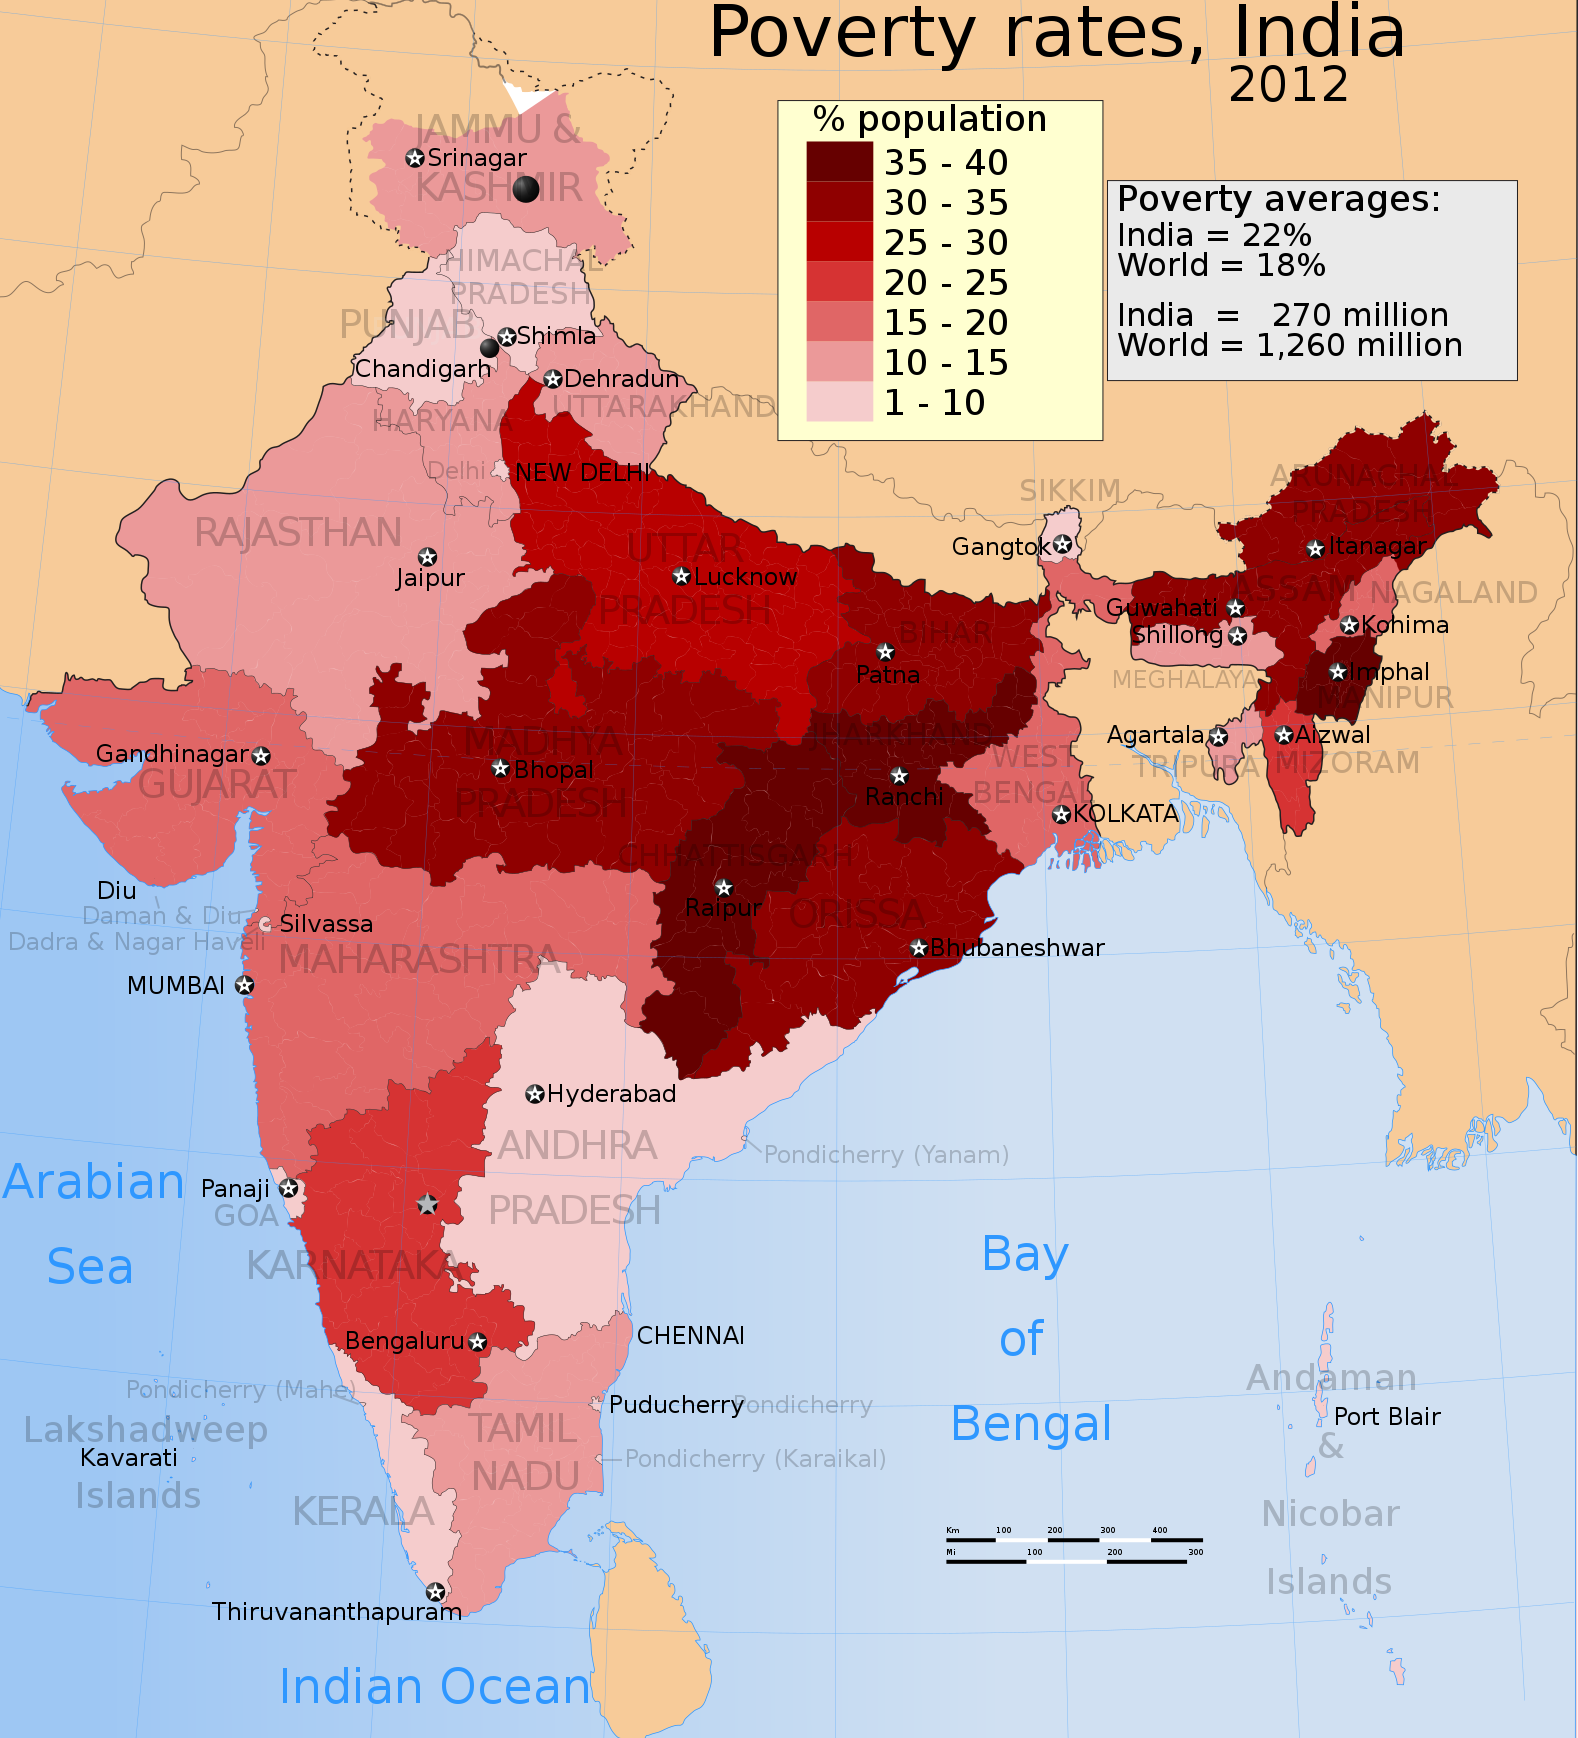
English: The map shows regional poverty rate distribution in India, by its states and UTs. The rate is headcount percentage published by Reserve Bank of India, based on MRP consumption data.
Data Source: Table 162, Number and percentage of population below poverty line, Reserve Bank of India (2013) There are 3 sub-tables in Table 162, each for different years. The data in the map above is for 2012 year. |
| 日期 | |
| 來源 | 自己的作品 |
| 作者 | M Tracy Hunter |
授權條款
我,本作品的著作權持有者,決定用以下授權條款發佈本作品:
此檔案採用創用CC 姓名標示-相同方式分享 3.0 未在地化版本授權條款。
- 您可以自由:
- 分享 – 複製、發佈和傳播本作品
- 重新修改 – 創作演繹作品
- 惟需遵照下列條件:
- 姓名標示 – 您必須指名出正確的製作者,和提供授權條款的連結,以及表示是否有對內容上做出變更。您可以用任何合理的方式來行動,但不得以任何方式表明授權條款是對您許可或是由您所使用。
- 相同方式分享 – 若要根據本素材進行再混合、轉換或創作,則必須以與原作相同或相容的授權來發布您的作品。
檔案歷史
點選日期/時間以檢視該時間的檔案版本。
| 日期/時間 | 縮圖 | 尺寸 | 使用者 | 備註 | |
|---|---|---|---|---|---|
| 目前 | 2016年1月16日 (六) 00:45 | | 1,578 × 1,738(823 KB) | फ़िलप्रो | added missing state name |
| 2014年7月16日 (三) 11:57 |  | 1,578 × 1,738(863 KB) | M Tracy Hunter | Captions | |
| 2014年7月9日 (三) 15:37 |  | 1,578 × 1,738(863 KB) | M Tracy Hunter | User created page with UploadWizard |
檔案用途
全域檔案使用狀況
以下其他 wiki 使用了這個檔案:
- bh.wikipedia.org 的使用狀況
- bn.wikipedia.org 的使用狀況
- de.wikipedia.org 的使用狀況
- en.wikipedia.org 的使用狀況
- fa.wikipedia.org 的使用狀況
- hi.wikipedia.org 的使用狀況
- hy.wikipedia.org 的使用狀況
- ja.wikipedia.org 的使用狀況
- kn.wikipedia.org 的使用狀況
- mk.wikipedia.org 的使用狀況
- sv.wikipedia.org 的使用狀況
- ta.wikipedia.org 的使用狀況
- ur.wikipedia.org 的使用狀況