跳至內容

File:Light wave harmonic diagram.svg

頁面內容不支援其他語言。
這個檔案來自維基共享資源
維基百科,自由的百科全書

原始檔案(SVG 檔案,表面大小:426 × 331 像素,檔案大小:172 KB)


摘要

描述
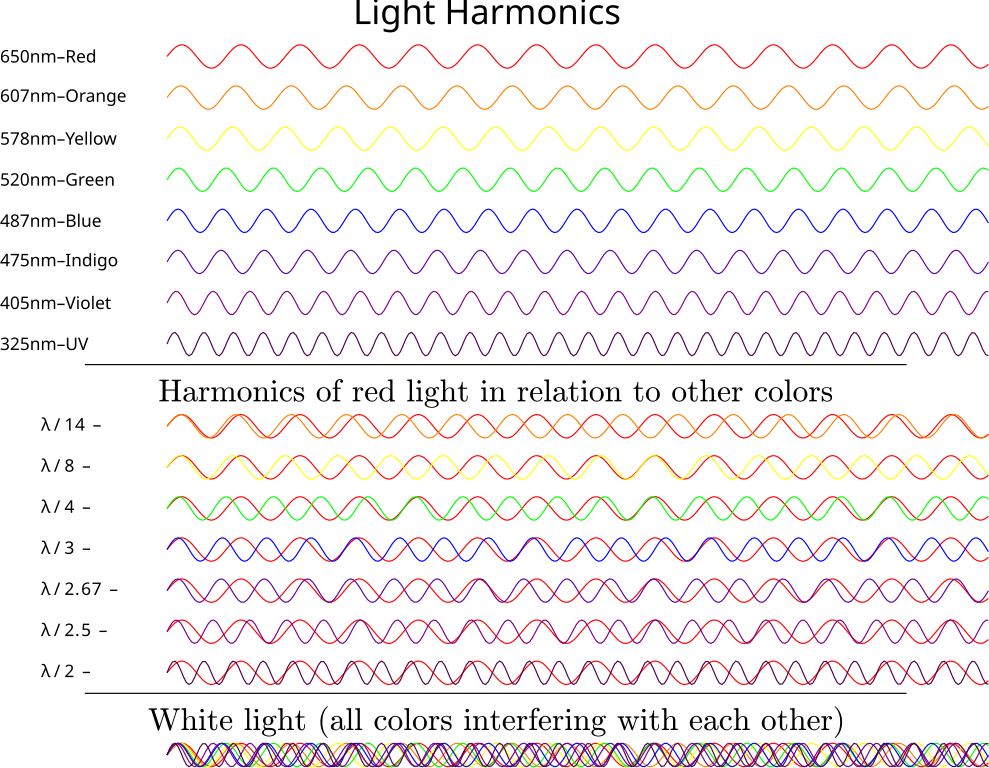
English: The harmonics of lightwaves drawn to scale, showing how the different waves interact with each other. The λ/2 (1/2 wavelength) harmonics are perfectly in sync with each other, but all other colors in the visual spectrum fall between λ and λ/2. Wavelengths that are separated by λ/4 are opposites, falling across from each other on the color wheel. (ie: Red is opposite of green, orange is opposite of blue, and yellow is opposite of violet.) Image was generated using Tikz and the resulting PDF was converted to SVG.
日期
來源 自己的作品
作者 Rubber Duck ()
SVG開發
InfoField
 
SVG檔案的原始碼通過W3C驗證
 
向量圖形使用Other tools創作。
Translate this file This SVG file contains embedded text that can be translated into your language, using any capable SVG editor, text editor or the SVG Translate tool. For more information see: About translating SVG files.
原始碼
InfoField

SVG code

Source code
\documentclass[12pt,border=1pt,tikz,class=scrartcl]{standalone}
\usepackage[latin1]{inputenc}
\usepackage{xcolor}
\usepackage{pgfplots}
\pagestyle{empty}
\begin{document}
\noindent
\begin{tikzpicture}[
label1/.style = {text width=5em,font=\tiny,align=left}
]
\node [font=\bfseries,text centered] at (4,-.5) {Light Harmonics};
\node [label1] at (-1,-1)   {650nm -- Red};
\node [label1] at (-1,-1.5) {607nm -- Orange};
\node [label1] at (-1,-2)   {578nm -- Yellow};
\node [label1] at (-1,-2.5) {520nm -- Green};
\node [label1] at (-1,-3)   {487nm -- Blue};
\node [label1] at (-1,-3.5) {475nm -- Indigo};
\node [label1] at (-1,-4)   {405nm -- Violet};
\node [label1] at (-1,-4.5) {325nm -- UV};
\begin{scope}[domain=0:10,samples=300]
	\draw [red] 	plot (\x,{-1+	sin(\x*500)r/400});
	\draw [orange] 	plot (\x,{-1.5+	sin(\x*535.42)r/400});
	\draw [yellow] 	plot (\x,{-2+	sin(\x*562.285)r/400});
	\draw [green] 	plot (\x,{-2.5+	sin(\x*625)r/400});
	\draw [blue] 	plot (\x,{-3+	sin(\x*667.35)r/400});
	\draw [color={rgb:red,75;green,0;blue,130}] 	plot (\x,{-3.5+	sin(\x*684.2)r/400});
	\draw [violet] 	plot (\x,{-4+	sin(\x*802.47)r/400});
	\draw [violet!60!black] 	plot (\x,{-4.5+	sin(\x*1000)r/400});
\end{scope}
\draw [black] (-1,-4.75) -- ++(10,0);
\node [text centered,font=\small] at (4,-5.1) {Harmonics of red light in relation to other colors};
\node [label1] at (-.5,-5.5)	{$\lambda$/14 --};
\node [label1] at (-.5,-6) 	{$\lambda$/8 --};
\node [label1] at (-.5,-6.5) 	{$\lambda$/4 --};
\node [label1] at (-.5,-7) 	{$\lambda$/3 --};
\node [label1] at (-.5,-7.5) 	{$\lambda$/2.67 --};
\node [label1] at (-.5,-8) 	{$\lambda$/2.5 --};
\node [label1] at (-.5,-8.5) 	{$\lambda$/2 --};
\begin{scope}[domain=0:10,samples=300]
	\draw[red]	plot (\x, {-5.5+	sin(\x*500)r/400});
	\draw[orange]	plot (\x, {-5.5+	sin(\x*535.42)r/400});
	\draw[red]	plot (\x, {-6+		sin(\x*500)r/400});
	\draw[yellow]	plot (\x, {-6+		sin(\x*562.285)r/400});
	\draw[red]	plot (\x, {-6.5+	sin(\x*500)r/400});
	\draw[green]	plot (\x, {-6.5+	sin(\x*625)r/400});
	\draw[red]	plot (\x, {-7+		sin(\x*500)r/400});
	\draw[blue]	plot (\x, {-7+		sin(\x*667.35)r/400});
	\draw[red]	plot (\x, {-7.5+	sin(\x*500)r/400});
	\draw [color={rgb:red,75;green,0;blue,130}] 	plot (\x,{-7.5+	sin(\x*684.2)r/400});
	\draw[red]	plot (\x, {-8+		sin(\x*500)r/400});
	\draw [violet] 	plot (\x, {-8+		sin(\x*802.47)r/400});
	\draw[red]	plot (\x, {-8.5+	sin(\x*500)r/400});
	\draw [violet!60!black] 	plot (\x,{-8.5+	sin(\x*1000)r/400});
\end{scope}
\draw [black] (-1,-8.75) -- ++(10,0);
\node [text centered,font=\small] at (4,-9.1) {White light (all colors interfering with each other)};
\begin{scope}[domain=0:10,samples=300]
	\draw [red] 	plot (\x,{-9.5+	sin(\x*500)r/400});
	\draw [orange] 	plot (\x,{-9.5+	sin(\x*535.42)r/400});
	\draw [yellow] 	plot (\x,{-9.5+	sin(\x*562.285)r/400});
	\draw [green] 	plot (\x,{-9.5+	sin(\x*625)r/400});
	\draw [blue] 	plot (\x,{-9.5+	sin(\x*667.35)r/400});
	\draw [color={rgb:red,75;green,0;blue,130}] 	plot (\x,{-9.5+	sin(\x*684.2)r/400});
	\draw [violet] 	plot (\x,{-9.5+	sin(\x*802.47)r/400});
	\draw [violet!60!black] 	plot (\x,{-9.5+	sin(\x*1000)r/400});
\end{scope}
\end{tikzpicture}
\end{document}

授權條款

我,本作品的著作權持有者,決定用以下授權條款發佈本作品:
w:zh:共享創意
姓名標示 相同方式分享
您可以自由:
  • 分享 – 複製、發佈和傳播本作品
  • 重新修改 – 創作演繹作品
惟需遵照下列條件:
  • 姓名標示 – 您必須指名出正確的製作者,和提供授權條款的連結,以及表示是否有對內容上做出變更。您可以用任何合理的方式來行動,但不得以任何方式表明授權條款是對您許可或是由您所使用。
  • 相同方式分享 – 如果您利用本素材進行再混合、轉換或創作,您必須基於如同原先的相同或兼容的條款,來分布您的貢獻成品。
GNU head 已授權您依據自由軟體基金會發行的無固定段落、封面文字和封底文字GNU自由文件授權條款1.2版或任意後續版本,對本檔進行複製、傳播和/或修改。該協議的副本列在GNU自由文件授權條款中。
您可以選擇您需要的授權條款。

說明

添加單行說明來描述出檔案所代表的內容

在此檔案描寫的項目

描繪內容

創作作者 Chinese (Hong Kong) (已轉換拼寫)

沒有維基數據項目的某些值

作者姓名字串 繁體中文 (已轉換拼寫):​Rubber Duck
維基媒體使用者名稱 繁體中文 (已轉換拼寫):​Krishnavedala

著作權狀態 繁體中文 (已轉換拼寫)

有著作權 繁體中文 (已轉換拼寫)

GNU自由文檔許可證1.2或更高版本 繁體中文 (已轉換拼寫)

共享創意署名-相同方式共享3.0Unported Chinese (Hong Kong) (已轉換拼寫)

檔案來源 Chinese (Taiwan) (已轉換拼寫)

上傳者的原創作品 繁體中文 (已轉換拼寫)

檔案歷史

點選日期/時間以檢視該時間的檔案版本。

日期/時間縮⁠圖尺寸用戶備⁠註
目前2017年9月19日 (二) 15:28於 2017年9月19日 (二) 15:28 版本的縮圖426 × 331(172 KB)Krishnavedalarecreated file with editable text using "latex" and "dvisvgm"
2015年4月22日 (三) 15:43於 2015年4月22日 (三) 15:43 版本的縮圖427 × 331(147 KB)Krishnavedalabetter rendering using "dvisvgm". unicode characters replaced by hand
2015年4月6日 (一) 19:40於 2015年4月6日 (一) 19:40 版本的縮圖434 × 338(295 KB)Krishnavedala{{Information |Description ={{en|1=The harmonics of lightwaves drawn to scale, showing how the different waves interact with each other. The λ/2 (1/2 wavelength) harmonics are perfectly in sync with each other, but all other colors in the visual sp...

下列頁面有用到此檔案:

全域檔案使用狀況

以下其他 wiki 使用了這個檔案:

詮釋資料