
File:Voltage regulator foldback.svg

此 SVG 檔案的 PNG 預覽的大小:278 × 276 像素。 其他解析度:242 × 240 像素 | 483 × 480 像素 | 774 × 768 像素 | 1,031 × 1,024 像素 | 2,063 × 2,048 像素。
原始檔案 (SVG 檔案,表面大小:278 × 276 像素,檔案大小:45 KB)
摘要
| 描述 |
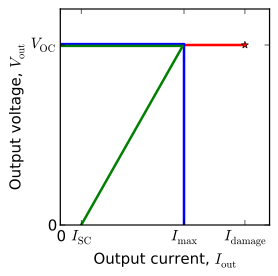
English: Voltage regulator V-I curves for foldback, current limited, and unlimited. |
| 日期 | |
| 來源 | 自己的作品 |
| 作者 | Nanite |
| SVG開發 | 本向量圖形使用Matplotlib創作。 |
| 原始碼 | Python code#Requires [[:wikipedia:matplotlib|matplotlib]]. Due to a bug in wikipedia's SVG renderer,
#the raw files appear with curves peeking outside of the axes.
#Before uploading the files were touched up by releasing and re-setting the clip paths.
from pylab import *
figtype = '.svg'
saveopts = {'bbox_inches':'tight'} #, 'transparent':True, 'frameon':True}
seterr(divide='ignore')
V_fb = concatenate([linspace(9.95,9.95,100, endpoint=False), linspace(9.95,0,101)])
I_fb = concatenate([linspace(0,0.995,100, endpoint=False), linspace(0.995,0.17,101)])
V_cl = concatenate([linspace(10.05,10.05,100, endpoint=False), linspace(10.05,0,101)])
I_cl = concatenate([linspace(0,1.005,100, endpoint=False), linspace(1.005,1.005,101)])
V_nl = linspace(10,10,151)
I_nl = linspace(0,1.5,151)
# Compute powers; Assume regulator is dropping voltage from a source 20% higher than V_oc.
P_cl = I_cl*(V_cl[0]*1.2 - V_cl)
P_fb = I_fb*(V_fb[0]*1.2 - V_fb)
P_nl = I_nl*(V_nl[0]*1.2 - V_nl)
Gcrit = 0.1
Rcrit = 10
Pcrit = 2
### Make V-I curve plot
fig = figure()
ax = axes()
xlim(0,1.7)
ylim(0,12)
ax.set_xlabel('Output current, $I_{\\rm out}$')
ax.set_xticks([I_fb[0], I_fb[-1], max(I_cl), max(I_nl)])
ax.set_xticklabels(['0', '$I_{\\rm SC}$', '$I_{\\rm max}$', '$I_{\\rm damage}$'])
ax.set_ylabel('Output voltage, $V_{\\rm out}$')
ax.set_yticks([0,10])
ax.set_yticklabels(['0', '$V_{\\rm OC}$'])
ax.plot(I_nl, V_nl, 'r', linewidth=2)
ax.plot([I_nl[-1]], [V_nl[-1]], 'r*', linewidth=2)
ax.plot(I_cl, V_cl, 'b', linewidth=2)
ax.plot(I_fb, V_fb, 'g', linewidth=2)
fig.set_size_inches(3,3)
fig.patch.set_alpha(0)
savefig('foldback-vi'+figtype, **saveopts)
### Make power and resistance load plot
fig = figure()
ax = axes()
xlim(0,0.5)
ylim(0,13)
ax.set_xlabel('Load conductance ($\Omega^{-1}$)')
#ax.set_xticks([0,0.1])
#ax.set_xticklabels(['0', '$G_{\\rm crit}$'])
ax.set_ylabel('Regulator heating power (W)')
ax.set_yticks([0,
round(P_fb[100],1),
round(max(P_fb),1),
round(P_fb[-1],1),
round(P_cl[-1],1)])
#ax.set_yticklabels(['0', '$P_{\\rm max,FB}$', '$P_{\\rm SC,FB}$','$P_{\\rm SC,CL}$'])
# Plot heat in regulator vs. conductance
ax.axvline(Gcrit, color='#777777', linestyle='dashed', linewidth=0.5)
ax.axhline(P_fb[-1], color='#777777', linestyle='dashed', linewidth=0.5)
ax.axhline(P_cl[-1], color='#777777', linestyle='dashed', linewidth=0.5)
ax.plot(I_nl/V_nl, P_nl, 'r', linewidth=2)
ax.plot([(I_nl/V_nl)[-1]], [P_nl[-1]], 'r*', linewidth=2)
ax.plot(I_cl/V_cl, P_cl, 'b', linewidth=2)
ax.plot(I_fb/V_fb, P_fb, 'g', linewidth=2)
ax.text(Gcrit/2, 9, 'OK', horizontalalignment='center')
ax.text(0.3, 9, 'Overload', horizontalalignment='center')
fig.set_size_inches(3,3)
fig.patch.set_alpha(0)
savefig('foldback-loadcon'+figtype, **saveopts)
### Make power and conductance load plot
fig = figure()
ax = axes()
xlim(0,16)
ylim(0,13)
ax.set_xlabel('Load resistance ($\Omega$)')
ax.set_xticks([0,5,10,15])
#ax.set_xticklabels(['0', '$G_{\\rm crit}$'])
ax.set_ylabel('Dissipation in regulator (W)')
#ax.set_yticks([0,
# round(P_fb[100],1),
# round(max(P_fb),1),
# round(P_fb[-1],1),
# round(P_cl[-1],1)])
#ax.set_yticklabels(['0', '$P_{\\rm max,FB}$', '$P_{\\rm SC,FB}$','$P_{\\rm SC,CL}$'])
# Plot heat in regulator vs. resistance
amfb = argmax(P_fb)
# grey lines
ax.axvline(Rcrit, color='#777777', linestyle='dashed', linewidth=0.5)
ax.plot([0,V_fb[amfb]/I_fb[amfb]], [P_fb[amfb]]*2, color='#777777', linestyle='dashed', linewidth=0.5)
ax.plot([0,Rcrit],[Pcrit,Pcrit], color='#777777', linestyle='dashed', linewidth=0.5)
#curves
ax.plot(V_nl/I_nl, P_nl, 'r', linewidth=2)
ax.plot([(V_nl/I_nl)[-1]], [P_nl[-1]], 'r*', linewidth=2)
ax.plot(V_cl/I_cl, P_cl, 'b', linewidth=2)
ax.plot(V_fb/I_fb, P_fb, 'g', linewidth=2)
ax.text(Rcrit/2, 12, 'Overloaded', horizontalalignment='center')
ax.text(13, 12, 'Normal', horizontalalignment='center')
fig.set_size_inches(3,3)
fig.patch.set_alpha(0)
savefig('foldback-loadres'+figtype, **saveopts)
|
授權條款
我,本作品的著作權持有者,決定用以下授權條款發佈本作品:
| 此檔案於創用 CC CC0 1.0 通用公有領域貢獻宣告下分發。 | |
| 在此宣告之下分發本作品者,已依據各國著作權法,在全世界放棄其對本作品所擁有的著作權及所有相關相似的法律權利,從而將本作品貢獻至公有領域。您可以複製、修改、分發和演示該作品,用於任何商業用途,所有這些都不需要請求授權。
|
檔案歷史
點選日期/時間以檢視該時間的檔案版本。
| 日期/時間 | 縮圖 | 尺寸 | 用戶 | 備註 | |
|---|---|---|---|---|---|
| 目前 | 2013年8月2日 (五) 06:41 | | 278 × 276(45 KB) | Nanite | labels, transparency |
| 2013年8月1日 (四) 14:17 |  | 278 × 274(25 KB) | Nanite | User created page with UploadWizard |
檔案用途
下列頁面有用到此檔案:
全域檔案使用狀況
以下其他 wiki 使用了這個檔案:
- ca.wikipedia.org 的使用狀況
- en.wikipedia.org 的使用狀況
- fa.wikipedia.org 的使用狀況
- it.wikibooks.org 的使用狀況