
File:20201211 Billion dollar events related to climate change - U.S. -en.svg

摘要
| 描述 |
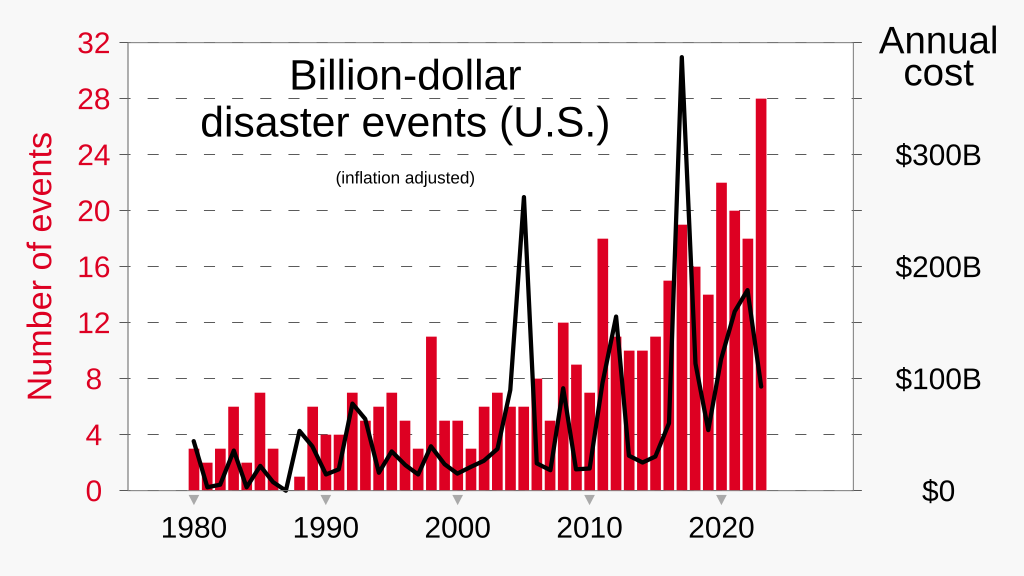
English: Graph of number billion-dollar climate-related events in the United States, and annual costs of those events, based on NOAA's National Centers for Environmental Information.
|
| 日期 | |
| 來源 | 自己的作品 |
| 作者 | RCraig09 |
.png)
Source data
Data through 2024.
Cost values for previous years change as successive years' data is added annually, presumably due to retroactive adjustments for inflation.
Click at right to show/hide data
|
|---|
|
Year _ Count _ Cost
|
授權條款
- 您可以自由:
- 分享 – 複製、發佈和傳播本作品
- 重新修改 – 創作演繹作品
- 惟需遵照下列條件:
- 姓名標示 – 您必須指名出正確的製作者,和提供授權條款的連結,以及表示是否有對內容上做出變更。您可以用任何合理的方式來行動,但不得以任何方式表明授權條款是對您許可或是由您所使用。
- 相同方式分享 – 若要根據本素材進行再混合、轉換或創作,則必須以與原作相同或相容的授權來發布您的作品。
檔案歷史
點選日期/時間以檢視該時間的檔案版本。
| 日期/時間 | 縮圖 | 尺寸 | 用戶 | 備註 | |
|---|---|---|---|---|---|
| 目前 | 2025年2月3日 (一) 11:38 | | 1,200 × 675(7 KB) | RCraig09 | Version 15: Update to include figures for 2024 that were revised by NOAA, probably during January |
| 2025年1月22日 (三) 06:47 |  | 1,200 × 675(7 KB) | RCraig09 | Version 14: Make left and right legends more explicit | |
| 2024年12月27日 (五) 17:22 |  | 1,200 × 675(7 KB) | RCraig09 | Version 13: add mostly opaque background to legend text, so it's not "floating" | |
| 2024年12月24日 (二) 19:25 |  | 1,200 × 675(7 KB) | RCraig09 | Version 12: Change dollars scale so line chart and bar chart are more evenly comparable, vertically | |
| 2024年12月23日 (一) 07:20 |  | 1,200 × 675(6 KB) | RCraig09 | Version 11: remove id="5MA" that was found objectionable by W3.org SVG checker | |
| 2024年12月23日 (一) 07:04 |  | 1,200 × 675(6 KB) | RCraig09 | Version 10: update to include 2024 data . . . add 5-year trailing average of annual costs . . . show annual costs as dots | |
| 2024年1月13日 (六) 04:54 |  | 1,200 × 675(4 KB) | RCraig09 | Version 9: revise to include data newly changed on NOAA website (25 ---> 28 events . . . . and $81.0B ---> $92.9B) | |
| 2024年1月1日 (一) 21:13 |  | 1,200 × 675(4 KB) | RCraig09 | Version 8: update to include 2023 data | |
| 2023年1月15日 (日) 17:09 |  | 1,200 × 675(4 KB) | RCraig09 | Version 7: change shade of red (avoiding the "primary color" tendency that's apparently falling into disfavor) | |
| 2022年12月31日 (六) 05:50 |  | 1,200 × 675(4 KB) | RCraig09 | Version 6: update to include data for 2022 |
檔案用途
下列頁面有用到此檔案:
全域檔案使用狀況
以下其他 wiki 使用了這個檔案:
- en.wikipedia.org 的使用狀況
- Federal Emergency Management Agency
- Economic analysis of climate change
- Environmental issues in the United States
- Climate change in the United States
- List of natural disasters in the United States
- Environmental policy of the first Donald Trump administration
- 2020 in climate change
- 2025 in climate change
- ga.wikipedia.org 的使用狀況
- pt.wikipedia.org 的使用狀況