
File:TaylorCosAllSVG.svg

此 SVG 檔案的 PNG 預覽的大小:680 × 600 像素。 其他解析度:272 × 240 像素 | 544 × 480 像素 | 870 × 768 像素 | 1,161 × 1,024 像素 | 2,321 × 2,048 像素。
原始檔案 (SVG 檔案,表面大小:680 × 600 像素,檔案大小:1.37 MB)
摘要
| 描述 |
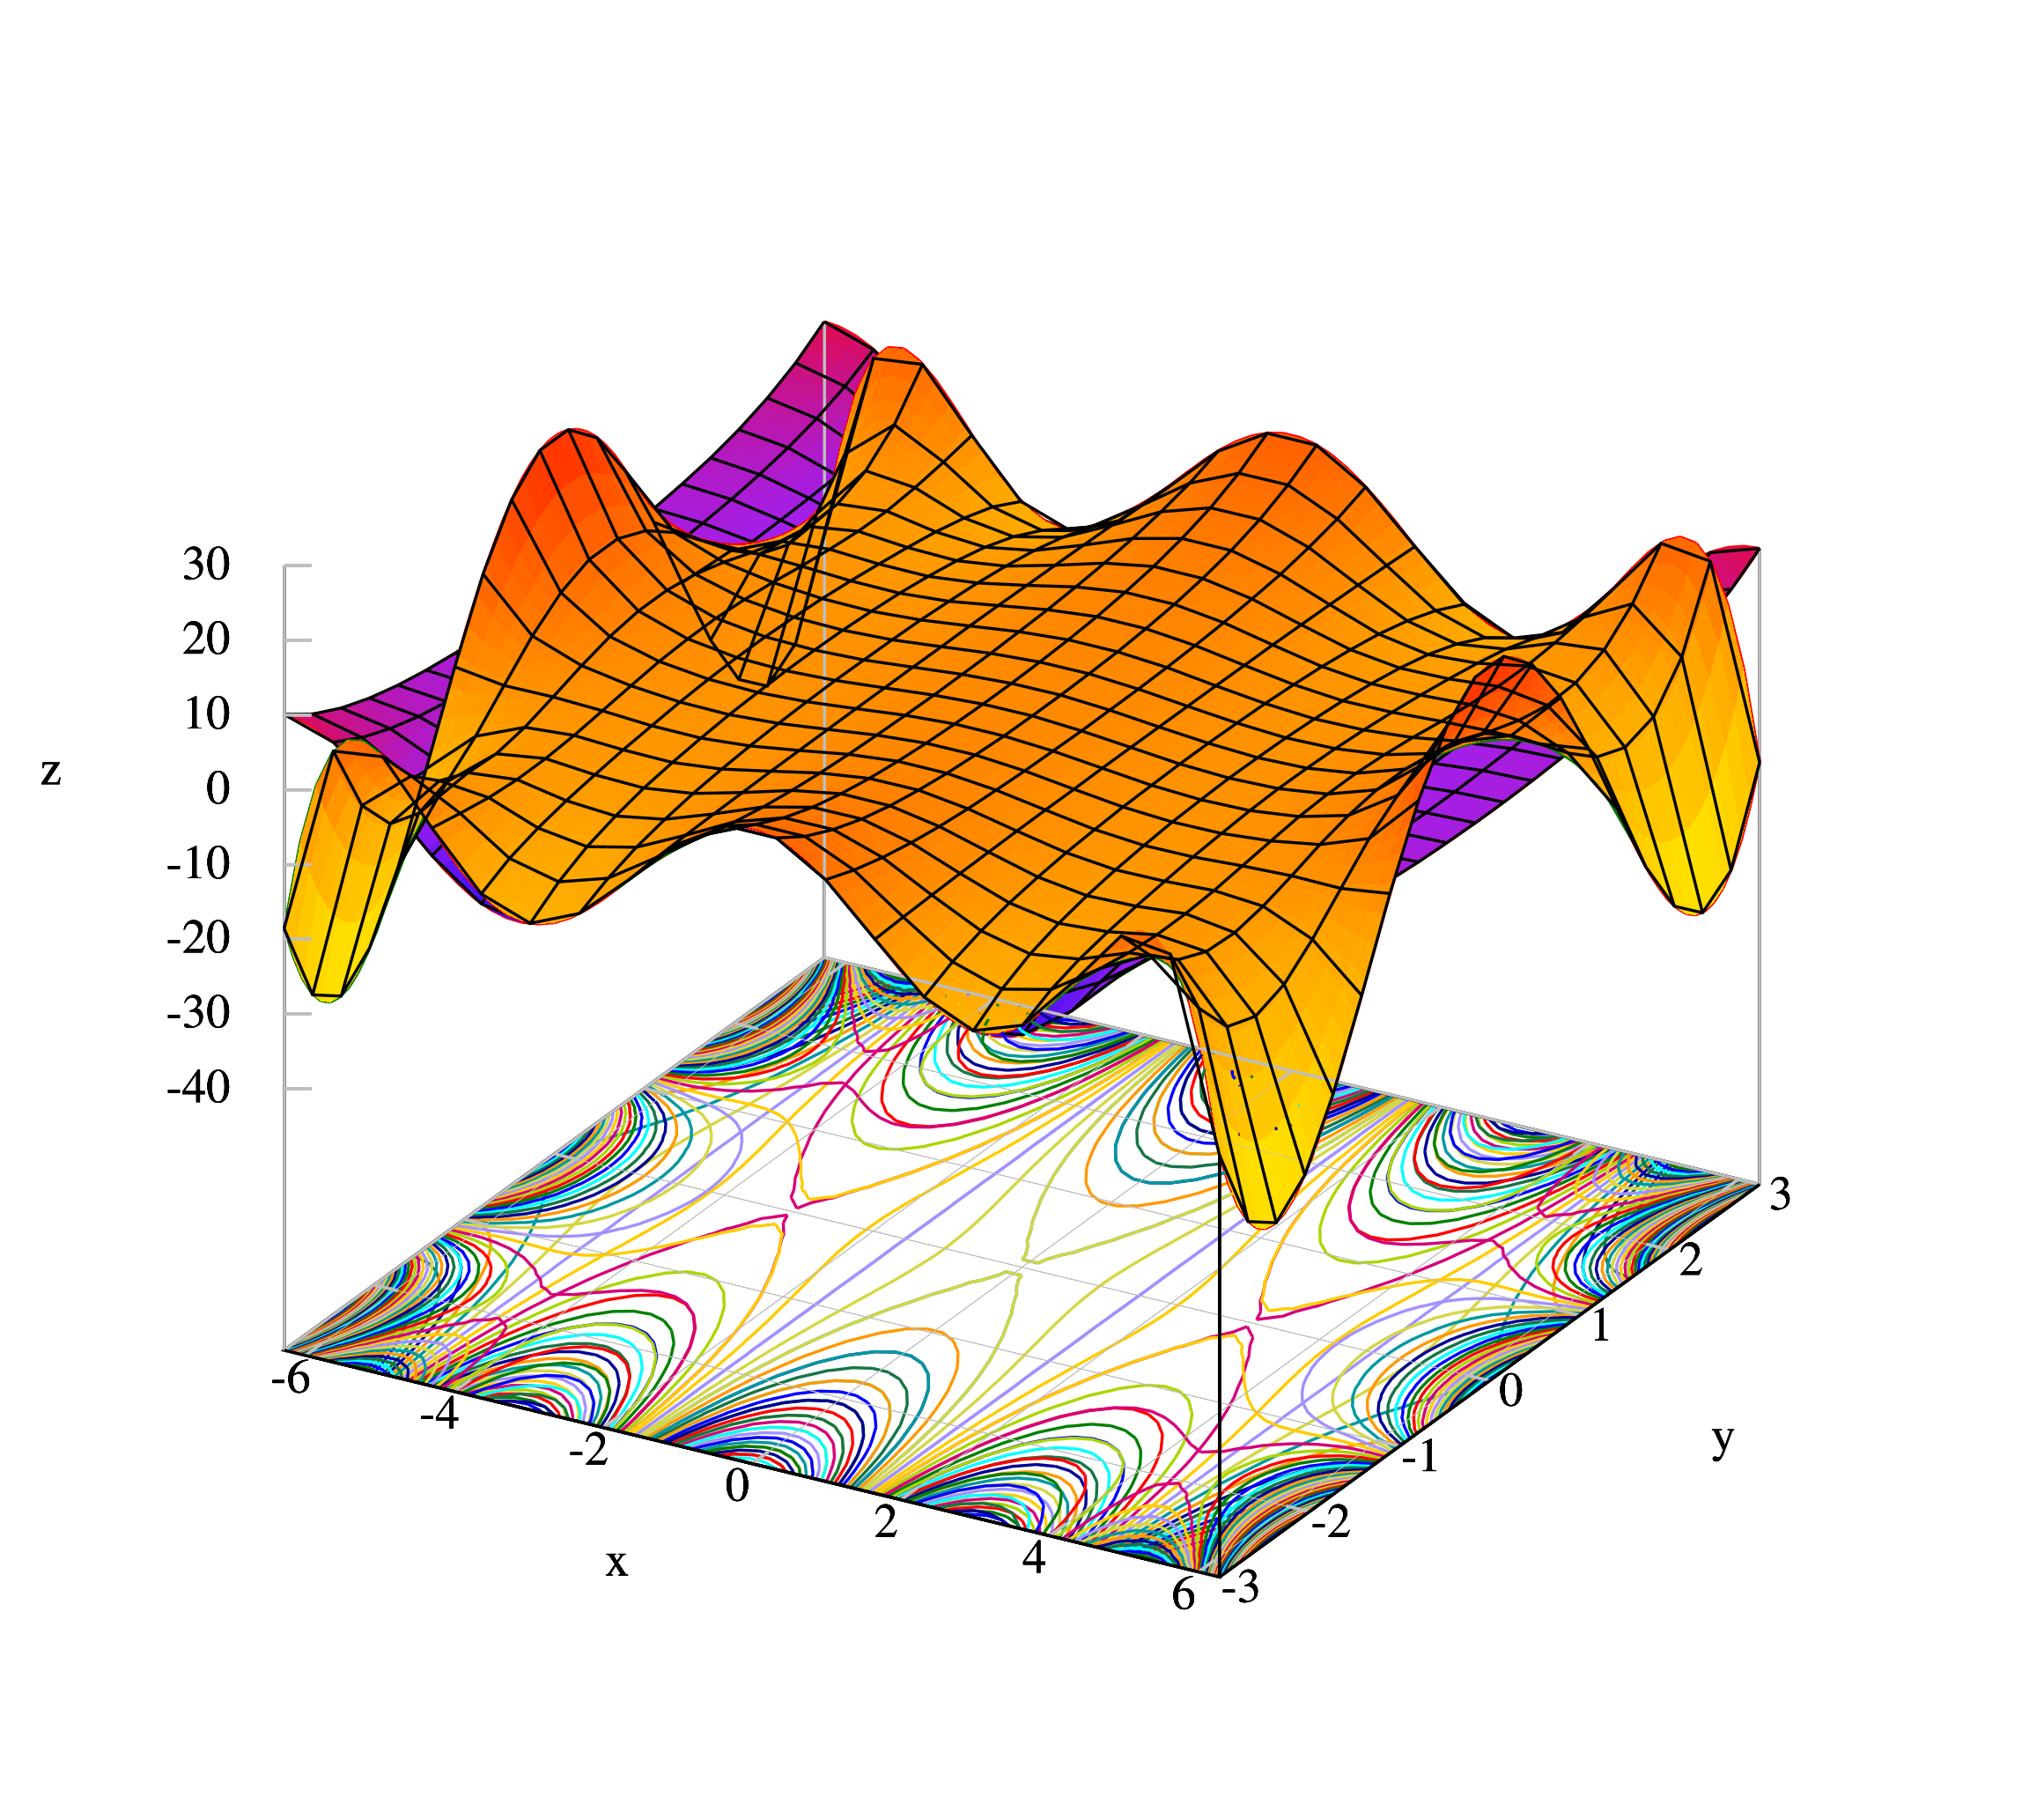
English: SVG edition for z=Re(cos(x+iy)) and its 8-degree Taylor expansion. |
| 日期 | |
| 來源 | 自己的作品 |
| 作者 | IkamusumeFan |
Generated by Gnuplot.
授權條款
我,本作品的著作權持有者,決定用以下授權條款發佈本作品:
此檔案採用創用CC 姓名標示-相同方式分享 3.0 未在地化版本授權條款。
- 您可以自由:
- 分享 – 複製、發佈和傳播本作品
- 重新修改 – 創作演繹作品
- 惟需遵照下列條件:
- 姓名標示 – 您必須指名出正確的製作者,和提供授權條款的連結,以及表示是否有對內容上做出變更。您可以用任何合理的方式來行動,但不得以任何方式表明授權條款是對您許可或是由您所使用。
- 相同方式分享 – 若要根據本素材進行再混合、轉換或創作,則必須以與原作相同或相容的授權來發布您的作品。
Gnuplot
set term svg size 680,600 enhanced font 'Times,12'
#set term post eps enhanced color font 'Times,12' linewidth 2
set output 'TaylorCosAllSVG.svg'

set multiplot

set cntrparam levels 100
set contour base
set isosamples 60,60
set samples 60,60
set xlabel "x"
set ylabel "y"
set zlabel "z"
set xrange [-2*pi:2*pi]
set yrange [-3:3]
set zrange [-40:30]
unset colorbox
unset key

# Draw the surface
set pm3d
set hidd
set grid layerdefault linetype -1 linecolor rgb "gray"  linewidth 0.200, linetype -1 linecolor rgb "gray"  linewidth 0.200
set palette defined (-1 "blue", 0 "purple", 1 "red")
i = {0.0,1.0}
splot real(cos(x+i*y))
# Draw the lines
unset cntrparam
unset contour
unset pm3d
unset hidd
set isosamples 20,20
set samples 20,20
splot real(cos(x+i*y)) lt rgb "black"

# Draw the surface
set zrange [-40:30]
set cntrparam levels 100
set contour base
set isosamples 60,60
set samples 60,60
set pm3d
set hidd
set grid layerdefault linetype -1 linecolor rgb "gray"  linewidth 0.200, linetype -1 linecolor rgb "gray"  linewidth 0.200
set palette defined (-1 "yellow", 0 "orange", 1 "red")
i = {0.0,1.0}
splot real(1-(x+i*y)**2/2! + (x+i*y)**4/4! - (x+i*y)**6/6! +(x+i*y)**8/8!)
# Draw the lines
unset cntrparam
unset contour
unset pm3d
unset hidd
set isosamples 20,20
set samples 20,20
splot real(1-(x+i*y)**2/2! + (x+i*y)**4/4! - (x+i*y)**6/6! +(x+i*y)**8/8!) lt rgb "black"
set view 29,53

unset multiplot
set term x11
set output
檔案歷史
點選日期/時間以檢視該時間的檔案版本。
| 日期/時間 | 縮圖 | 尺寸 | 使用者 | 備註 | |
|---|---|---|---|---|---|
| 目前 | 2013年7月22日 (一) 11:18 | | 680 × 600(1.37 MB) | IkamusumeFan | User created page with UploadWizard |
檔案用途
下列頁面有用到此檔案:
全域檔案使用狀況
以下其他 wiki 使用了這個檔案:
- hi.wikipedia.org 的使用狀況
- hy.wikipedia.org 的使用狀況
- uk.wikipedia.org 的使用狀況