
File:CO2 emission pie chart.svg

此SVG文件的PNG预览的大小:600 × 600像素。 其他分辨率:240 × 240像素 | 480 × 480像素 | 768 × 768像素 | 1,024 × 1,024像素 | 2,048 × 2,048像素 | 900 × 900像素。
原始文件 (SVG文件,尺寸为900 × 900像素,文件大小:3 KB)
摘要
| 描述 |
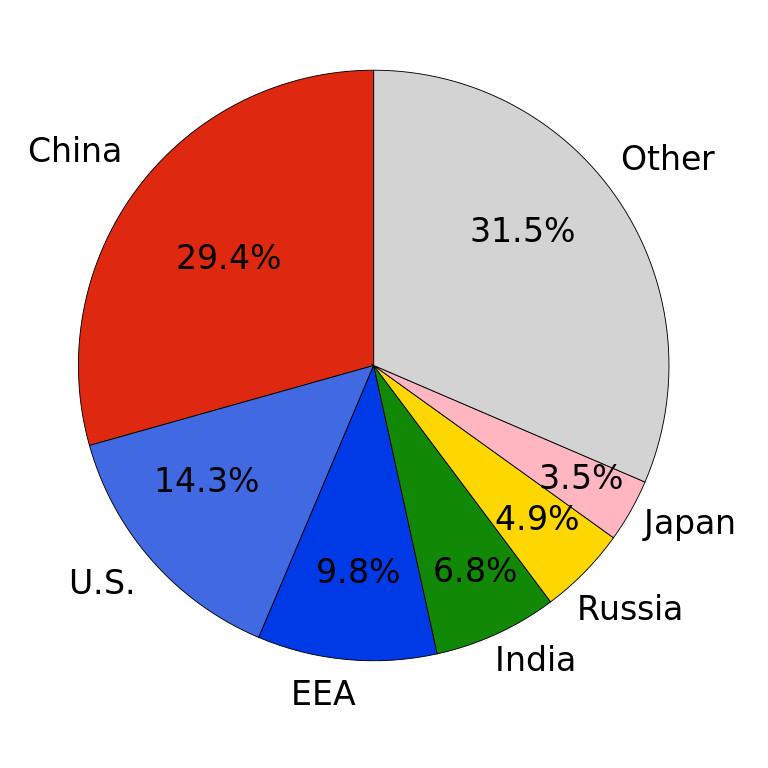
Català: Emissions globals de gasos CO2 l'any 2015 per país.
English: Global CO2 gas emissions in the year 2015 by country. EEA is the European Economic Area.
|
|||
| 日期 | ||||
| 来源 | 自己的作品 | |||
| 作者 | Árni Dagur | |||
| 授权 (二次使用本文件) |
|
|||
| 其他版本 |
File:CO2 emission pie chart.svg has 3 translations.
Other related versions:[]
|
|||
| SVG开发 | 本图表使用Matplotlib创作。 | |||
| 源代码 | Python code#Very slight changes were made in a text editor.
import matplotlib.pyplot as plt
print('Styles:', plt.style.available)
plt.rcdefaults()
plt.style.use('ggplot')
plt.rcParams['font.size'] = 19
plt.rcParams['patch.edgecolor'] = 'black'
plt.rcParams['lines.linewidth'] = 1
plt.figure(figsize=[6,6])
labels = ['China', 'USA', 'EEA', 'India', 'Russia', 'Japan', 'Other']
sizes = [29.3641757, 14.27217116, 9.814753272, 6.774059821, 4.858885975, 3.457132848, 31.458821414]
colours = ['#de2910', 'royalblue', '#0039e6', '#128807', 'gold', '#ffb6c1', 'lightgrey']
angle = 90
explode = (0, 0, 0, 0, 0, 0, 0)
# ^-- Change this to 0.1 for an explosion effect.
patches, texts, autotexts = plt.pie(sizes, explode=explode, colors=colours, autopct='%1.1f%%', pctdistance=0.815, labels=labels, labeldistance=1.1, shadow=False, startangle=angle)
for at in autotexts:
at.set_fontsize(16.21)
plt.axis('equal')
plt.tight_layout()
plt.gca().set_position([0, 0, 1, 1])
plt.gcf().subplots_adjust(bottom=0.15)
plt.savefig('co2_emission_pie_chart.svg')
|


| 此SVG檔案包含可翻譯至您的語言的内嵌文字,可以使用任何可用SVG編輯器、文本編輯器或SVG翻譯工具來翻譯。詳情請見:關於翻譯SVG檔案。 |
此檔案使用SVG <switch>元素翻譯。所有的譯文都儲存在同一檔案中!了解更多。
請在 要將此檔案中的文字翻譯成您的語言,您可以使用SVG 翻譯工具。或者,您可以將該檔案下載至您的電腦中,使用您熟悉的任何軟體進行翻譯,然後使用「相同」名稱重新上傳。如果不確定如何進行此操作,您能在圖像實驗室中找到幫助。 |
(Data source: Emission Database for Global Atmospheric Research)
Please feel free to change the colours and update this image.
许可协议
我,本作品著作权人,特此采用以下许可协议发表本作品:
| 本作品采用知识共享CC0 1.0 通用公有领域贡献许可协议授权。 | |
| 采用本宣告发表本作品的人,已在法律允许的范围内,通过在全世界放弃其对本作品拥有的著作权法规定的所有权利(包括所有相关权利),将本作品贡献至公有领域。您可以复制、修改、传播和表演本作品,将其用于商业目的,无需要求授权。
|
文件历史
点击某个日期/时间查看对应时刻的文件。
| 日期/时间 | 缩略图 | 大小 | 用户 | 备注 | |
|---|---|---|---|---|---|
| 当前 | 2025年3月19日 (三) 17:37 | | 900 × 900(3 KB) | RCraig09 | Version 11: Correcting typo for China: 24.0 ---> 24.0 |
| 2025年2月19日 (三) 05:15 |  | 900 × 900(3 KB) | RCraig09 | Version 10: Uploading chart updated through 2023. . . . different source. . . . Also, is leaner (only 3KB) . . . . I have manually retained the ES and CA translations using <switch> designations | |
| 2024年1月31日 (三) 00:11 |  | 540 × 540(76 KB) | Manlleus | File uploaded using svgtranslate tool (https://svgtranslate.toolforge.org/). Added translation for es. | |
| 2024年1月31日 (三) 00:02 |  | 540 × 540(62 KB) | Manlleus | File uploaded using svgtranslate tool (https://svgtranslate.toolforge.org/). Added translation for ca. | |
| 2024年1月30日 (二) 23:59 |  | 540 × 540(37 KB) | Manlleus | fixed text labels for translation | |
| 2017年6月8日 (四) 04:17 |  | 540 × 540(54 KB) | Illegitimate Barrister | Centering. | |
| 2017年6月8日 (四) 04:15 |  | 540 × 540(36 KB) | Illegitimate Barrister | WP:NOTUSA | |
| 2017年6月8日 (四) 01:34 |  | 540 × 540(30 KB) | ArniDagur | fixed wrong upload | |
| 2017年6月8日 (四) 01:32 |  | 540 × 540(30 KB) | ArniDagur | lines made black and smaller, font size increased, general improvements | |
| 2017年6月8日 (四) 00:41 |  | 720 × 540(30 KB) | ArniDagur | made font bigger |
文件用途
以下页面使用本文件:
全域文件用途
以下其他wiki使用此文件:
- bn.wikipedia.org上的用途
- ca.wikipedia.org上的用途
- ckb.wikipedia.org上的用途
- cy.wikipedia.org上的用途
- da.wikipedia.org上的用途
- de.wikipedia.org上的用途
- en.wikipedia.org上的用途
- es.wikipedia.org上的用途
- fr.wikipedia.org上的用途
- ha.wikipedia.org上的用途
- hu.wikipedia.org上的用途
- hy.wikipedia.org上的用途
- ig.wikipedia.org上的用途
- it.wikipedia.org上的用途
- ka.wikipedia.org上的用途
- ms.wikipedia.org上的用途
- or.wikipedia.org上的用途
- pt.wikipedia.org上的用途
- ro.wikipedia.org上的用途
- ru.wikipedia.org上的用途
- ru.wikinews.org上的用途
- so.wikipedia.org上的用途
- te.wikipedia.org上的用途
- uk.wikipedia.org上的用途
- uz.wikipedia.org上的用途
- vi.wikipedia.org上的用途
- www.wikidata.org上的用途