
File:2012 Poverty distribution map in India by its states and union territories.svg

此SVG文件的PNG预览的大小:544 × 599像素。 其他分辨率:218 × 240像素 | 436 × 480像素 | 697 × 768像素 | 930 × 1,024像素 | 1,859 × 2,048像素 | 1,578 × 1,738像素。
原始文件 (SVG文件,尺寸为1,578 × 1,738像素,文件大小:823 KB)
摘要
| 描述 |
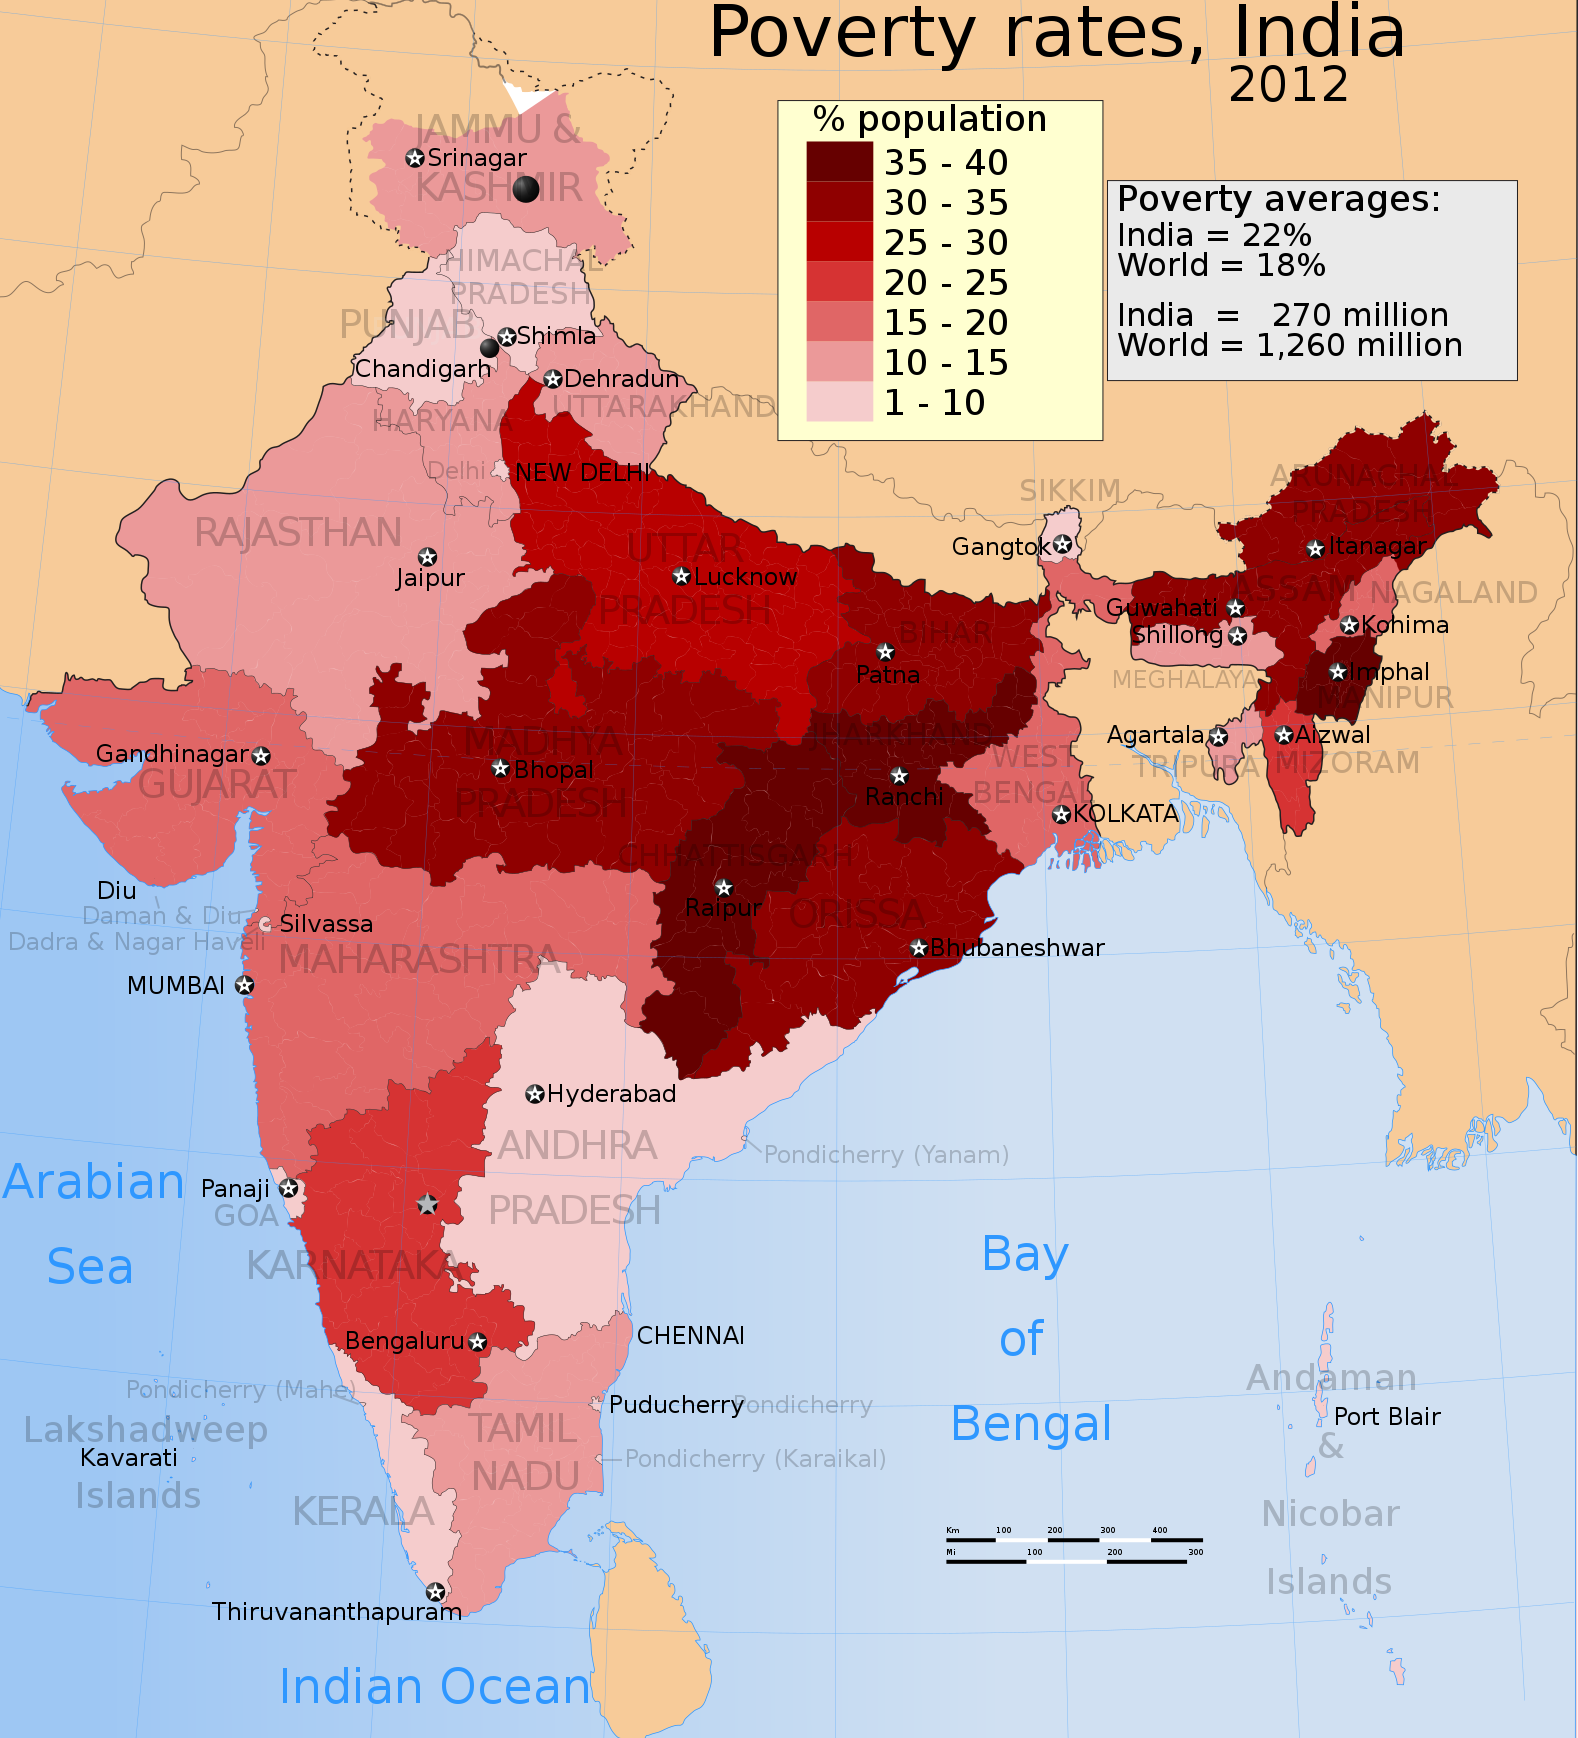
English: The map shows regional poverty rate distribution in India, by its states and UTs. The rate is headcount percentage published by Reserve Bank of India, based on MRP consumption data.
Data Source: Table 162, Number and percentage of population below poverty line, Reserve Bank of India (2013) There are 3 sub-tables in Table 162, each for different years. The data in the map above is for 2012 year. |
| 日期 | |
| 来源 | 自己的作品 |
| 作者 | M Tracy Hunter |
许可协议
我,本作品著作权人,特此采用以下许可协议发表本作品:
本文件采用知识共享署名-相同方式共享 3.0 未本地化版本许可协议授权。
- 您可以自由地:
- 共享 – 复制、发行并传播本作品
- 修改 – 改编作品
- 惟须遵守下列条件:
- 署名 – 您必须对作品进行署名,提供授权条款的链接,并说明是否对原始内容进行了更改。您可以用任何合理的方式来署名,但不得以任何方式表明许可人认可您或您的使用。
- 相同方式共享 – 如果您再混合、转换或者基于本作品进行创作,您必须以与原先许可协议相同或相兼容的许可协议分发您贡献的作品。
文件历史
点击某个日期/时间查看对应时刻的文件。
| 日期/时间 | 缩略图 | 大小 | 用户 | 备注 | |
|---|---|---|---|---|---|
| 当前 | 2016年1月16日 (六) 00:45 | | 1,578 × 1,738(823 KB) | फ़िलप्रो | added missing state name |
| 2014年7月16日 (三) 11:57 |  | 1,578 × 1,738(863 KB) | M Tracy Hunter | Captions | |
| 2014年7月9日 (三) 15:37 |  | 1,578 × 1,738(863 KB) | M Tracy Hunter | User created page with UploadWizard |
文件用途
全域文件用途
以下其他wiki使用此文件:
- bh.wikipedia.org上的用途
- bn.wikipedia.org上的用途
- de.wikipedia.org上的用途
- en.wikipedia.org上的用途
- fa.wikipedia.org上的用途
- hi.wikipedia.org上的用途
- hy.wikipedia.org上的用途
- ja.wikipedia.org上的用途
- kn.wikipedia.org上的用途
- mk.wikipedia.org上的用途
- sv.wikipedia.org上的用途
- ta.wikipedia.org上的用途
- ur.wikipedia.org上的用途